Connecting the Unity Profiler to your iOS Device
While doing some contract work recently I found that the Unity Profiler no longer reports accurate texture memory figures for mobile while you are in editor. Maybe it never did but I swear it did an some point. Rest assured, all the texture compression settings are still fine, you just have to test on device now. I had never done this with the latest release of Unity and remembered the days where I wished I could. So I gave it a bash and it is dope! Here are the steps you follow:
-
Make sure your mobile device is on the wifi network. The profiler uses a network connection to send data back to Unity.
-
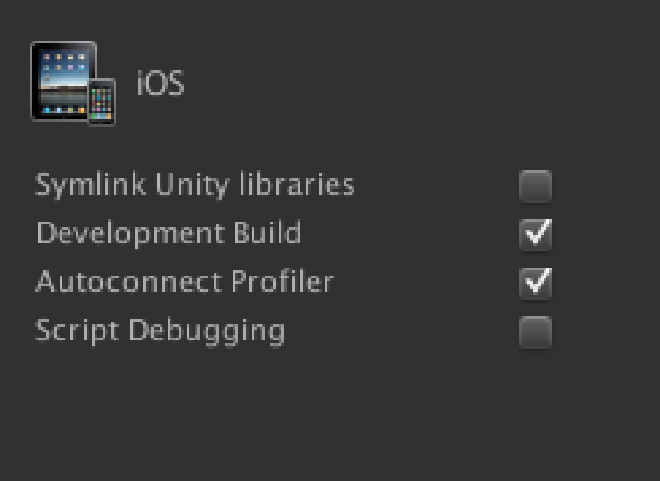
Make sure you have “Development Build” and “Auto Connect Profiler” check to on in the build settings (handy shortcut for the build menu, Command + Shift + B)

-
Build for XCode. Make sure you are using a profile that allows you to be running the XCode debugger, so not an enterprise profile.
-
When the game launches, grab the IP address that appears in the XCode debug console. It will have a port number so make sure to get that as well.

-
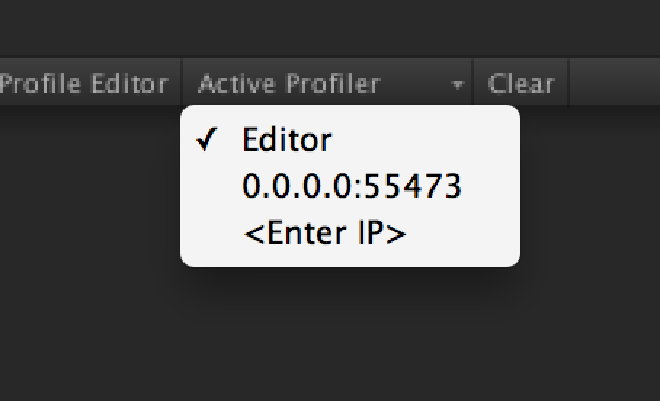
In Unity, in the profiler, click on the “Active Profiler” button in the bar at the top. Sometimes it picks it up automatically, but if not, dump in the IP address and port number in the box provided when you click “
”. 
Thats it! Super simple and effective. Now the data that you see in the profiler is live from your device. Thanks a ton Unity!
